Learn how to keep track of your employees' journey, as well as be informed on the organization's trends and the progress against your company-wide goals.
What is my organization’s Wellics™ Index?
How is my organization’s Wellics™ Index calculated?
View your organization’s trends
Compare your employees’ progress to your company-wide goals
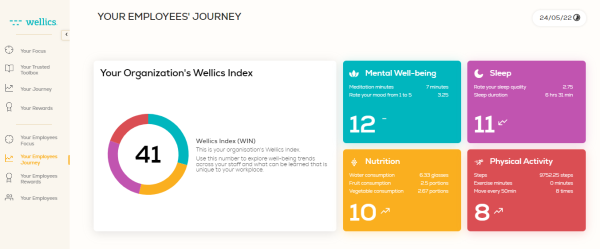
What is my organization’s Wellics™ Index?
The organization’s Wellics™ Index (WIN) reflects the daily total score of all your employees’ WIN on four dimensions: Sleep, Mental Health, Physical Activity, and Nutrition.
To view your organization’s Wellics™ Index:
- In the left sidebar menu, click Your Employees' Journey.
- Scroll down until Your Organization's Wellics™ Index area.
- Click on the top calendar to see the organization’s WIN of another day.
Please note:
- If your organization’s Wellics™ Index scores low, it can be due to two different reasons:
- Your employees have indeed reduced levels of well-being.
- Your employees do not log enough data for the proper calculations of the Wellics™ Index.
How is my organization’s Wellics™ Index calculated?
Your organization’s Wellics™ Index (WIN) is the average of all employees’ Wellics™ Index. It starts from 0 every day (when no data is available) and may reach its maximum value (100) when all daily data from your employees have been filled in.
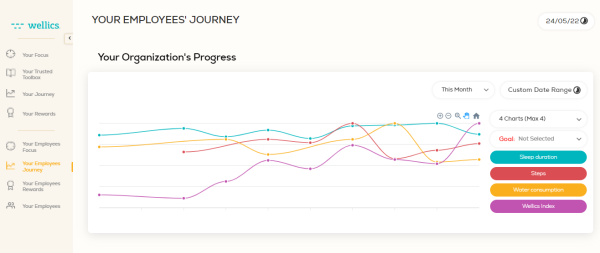
View your organization's trends
You may see the progress your people are making and the trends of your team on various well-being metrics on a chart for a specific period that you will select.
To see the current monthly trends on the chart:
- In the left sidebar menu, click Your Employees' Journey.
- View the Your Organization’s Progress area.
- By default, the timeline shows data of sleep duration, steps, water consumption, and Wellics™ Index for the last month (30 days ago).
To change the period of the chart:
- Click on This Month drop-down list.
- Select another timeframe option from the list.
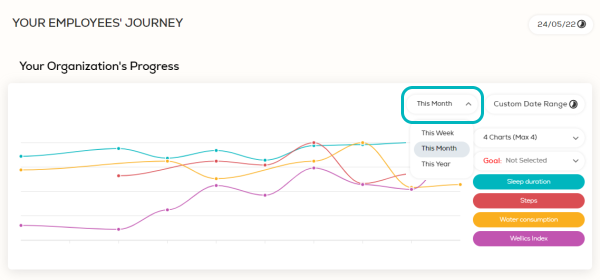
OR:
- Click on Custom Date Range calendar.
- Select the period (from-to) by clicking on the first and last date on the calendar.
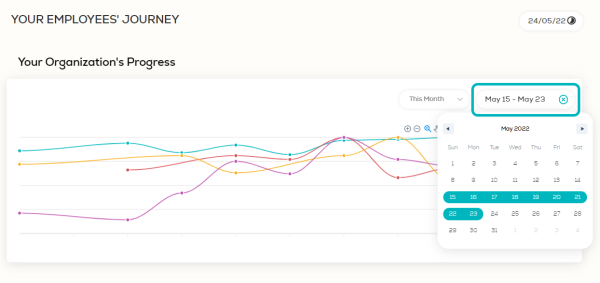
- View the selected data on the chart.
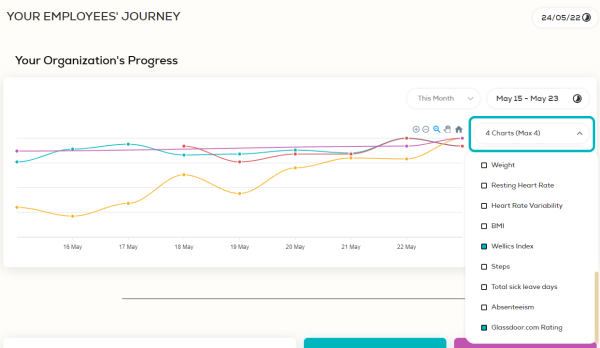
To change the metrics that are displayed on the chart:
- Click the 4 Charts (4 Max) drop-down list.
- De-select the ones already selected.
- Select the metrics that you want to view on the chart. Scroll down the list to see all available metrics.
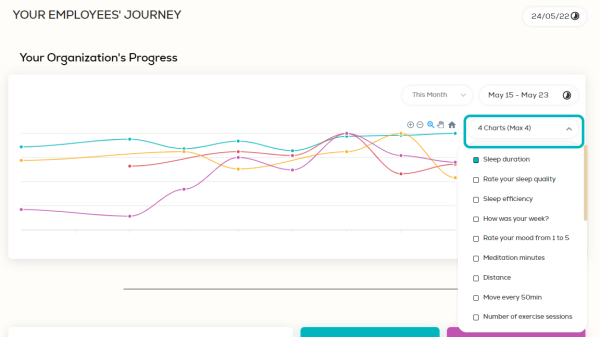
- View the selected data on the chart.
Additional actions on chart:
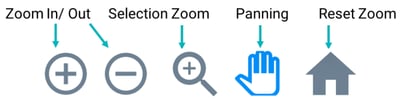
- You may zoom in on the whole chart by clicking on the Zoom In button.
- You may zoom in on a specific part of the chart by clicking on the Selection Zoom and then click and hold to draw an area on the chart that includes your preferred part (available only on the web).
- You may move the zoomed-in chart by clicking on the Panning button and then click, hold, and move left or right to the specific part you want to view (available only on the web).
- You may zoom out the whole chart by clicking on the Zoom Out button.
- Return to the original view by clicking on the Reset zoom button.
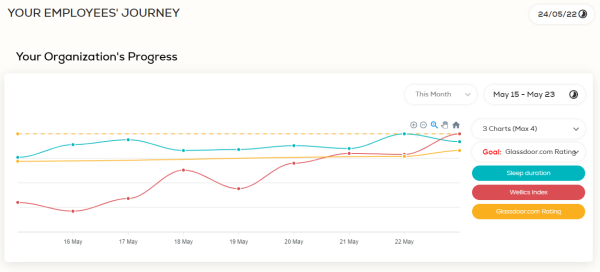
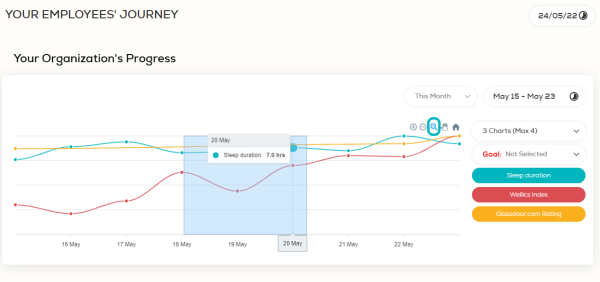
Compare your employees’ progress to your company-wide goals
You may view what is the relevance of your employees’ progress on various well-being metrics with your company-wide goals.
- In the left sidebar menu, click Your Employees' Journey.
- View the Your Organization’s Progress area.
- Click the 4 Charts (4 Max) drop-down list.
- De-select the ones already selected.
- Select up to three standard wellness metrics that you want to view on the chart and a corporate one that reflects the company-wide goal. Scroll down the list to see all available metrics.
- Click the Goal: Not selected drop-down list.
- Select the company-wide goal (the same with the metric selected in step 5).
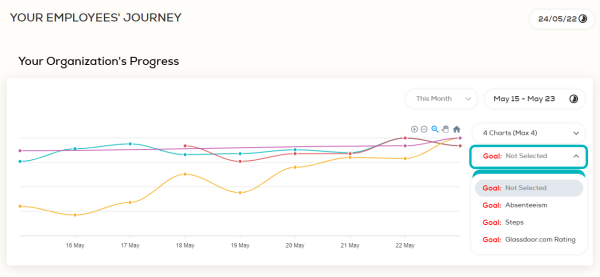
- View the company-wide goal illustrated with a dotted line on the chart.