Learn how to keep track of your progress on your well-being journey.
The data you have logged manually or have been collected automatically from the wearable will reveal patterns in your behavior and give you useful insights on which of your habits affect your well-being positively or negatively. You will be able to assess if a small or big change you made increased your well-being and use this information to make decisions.
How is my Wellics™ Index calculated?
Compare your progress to your well-being goals
What is my Wellics™ Index?
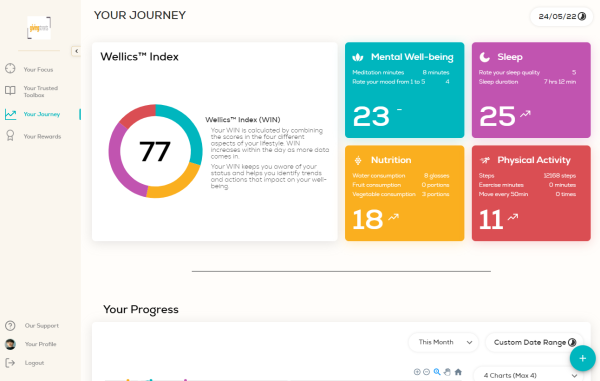
Wellics™ Index (WIN) reflects your daily well-being. The bigger the number, the higher your well-being state. It is considers your input on four dimensions: Sleep, Mental Well-being, Physical Activity, and Nutrition. Try to provide your input daily and watch your score change!
To view your Wellics™ Index:
- In the left sidebar menu, click
 .
. - View the Wellics™ Index area.
- The number in the circle is your real-time WIN.
- The numbers in the colored cards on the right display the data you have entered so far for each metric along with a daily score for each dimension.
Please note:
- If your Wellics™ Index is low this might mean that the data, you have provided are not sufficient for its calculation.
How is my Wellics™ Index calculated?
Your Wellics™ Index (WIN) is calculated by totaling the figures of your responses on a daily basis. The WIN considers the following metrics, either automatically or manually logged:
- Mental energy audit
- Current mood
- Water consumption
- Fruit consumption
- Vegetable consumption
- Subjective sleep quality
- Sleep duration
- Steps
- Exercise minutes
- Move every 50min
It starts from 0 everyday (when no data is available) and may reach its maximum value (100) when you have filled in all daily data.
Please note:
- If you do not fill in all 10 metrics daily, then your daily Wellics™ Index will be much lower than expected. This will prohibit you to understand the patterns and which metrics mainly affect your well-being. Moreover, your organization will get the wrong impression of the employees’ well-being.
View your trends
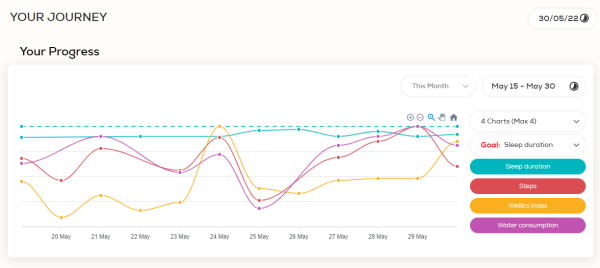
You may see your progress and trends on various well-being metrics on a chart for a specific period that you will select.
To see the current monthly trends on the chart:
- In the left sidebar menu, click Your Journey.
- View the Your Progress area.
- By default, the timeline shows data of sleep duration, steps, water consumption, and Wellics™ Index for the last month (30 days ago).
To change the time period of the chart:
- Click on This month drop-down list.
- Select another timeframe option from the list.
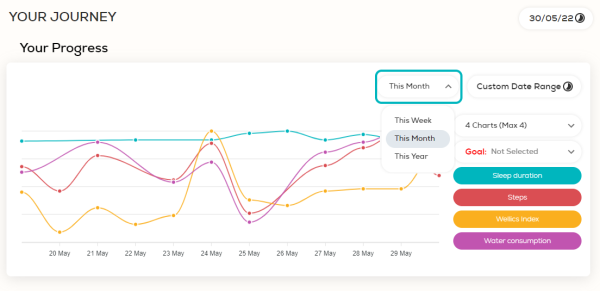
OR
- Click on Custom Date Range calendar.
- Select the period (from - to) by clicking on the first and last date on the calendar.
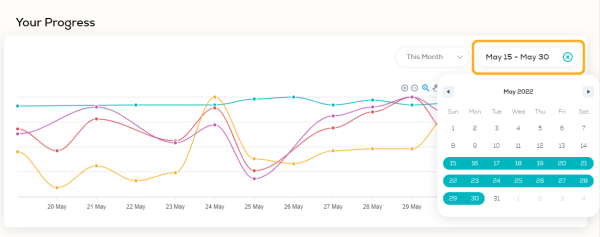
- View the selected data on the chart.
To change the metrics that are displayed on the chart:
- Click the 4 Charts (4 Max) drop-down list.
- De-select the ones already selected.
- Select the metrics that you want to view on the chart. Scroll down the list to see all available metrics.
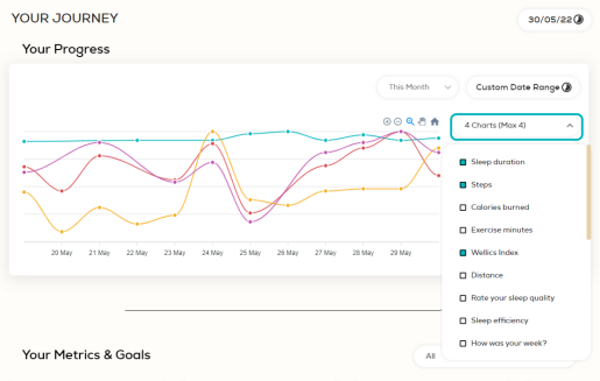
- View the selected data on the chart.
Additional actions on chart:
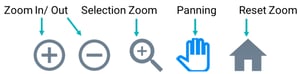
- You may zoom in the whole chart by clicking on the Zoom In button.
- You may zoom in a specific part of the chart by clicking on the Selection Zoom and then click and hold to draw an area on the chart that includes your preferred part (available only on web).
- You may move the zoomed-in chart by clicking on the Panning button and then click, hold, and move left or right to the specific part you want to view (available only on web).
- You may zoom out the whole chart by clicking on the Zoom Out button.
- Return to original view by clicking on the Reset zoom button.
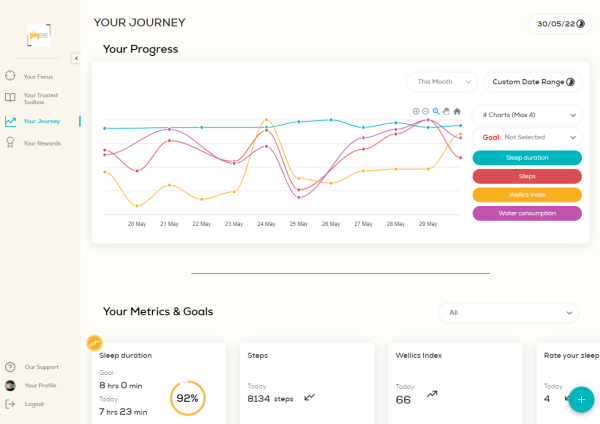
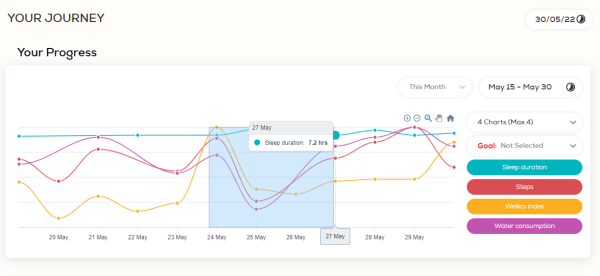
Compare your progress to your well-being goals
You may view what is the relevance of your progress on various well-being metrics with your goals.
- In the left sidebar menu, click Your Journey.
- View the Your Progress area.
- Click the 4 Charts (4 Max) drop-down list.
- Make sure that the metric related to your goal is selected. If not, de-select any of the ones already selected and select your goal.
- Click the Goal: Not selected drop-down list.
- Select your goal (the same with the metric selected in step 4).
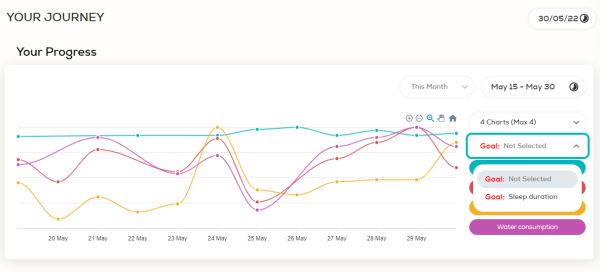
- View the company-wide goal illustrated with a dotted line on the chart.